Edit chart
Loading graph
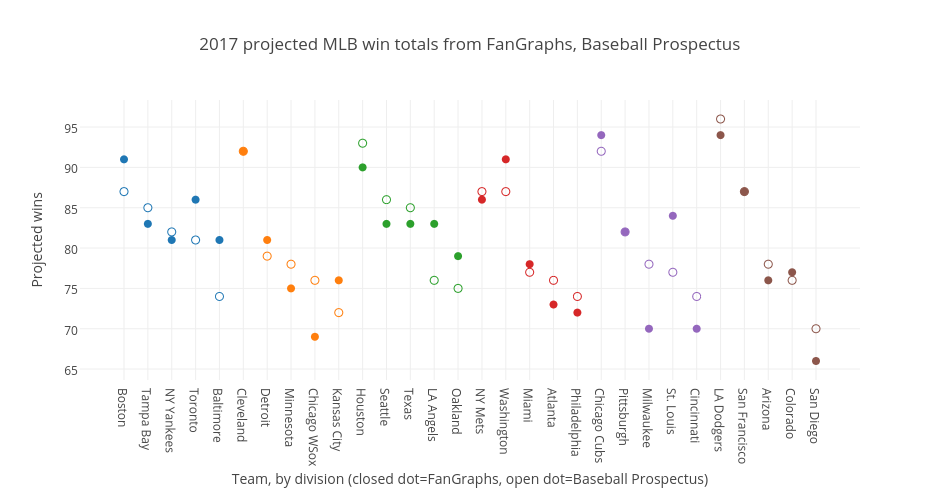
Grspur's interactive graph and data of "2017 projected MLB win totals from FanGraphs, Baseball Prospectus" is a scatter chart, showing B, C, E, F, H, I, K, L, N, O, Q, R; with Team, by division (closed dot=FanGraphs, open dot=Baseball Prospectus) in the x-axis and Projected wins in the y-axis.. The x-axis shows values from -1.8439306358381502 to 30.84393063583815. The y-axis shows values from 63.64462809917355 to 98.35537190082644.