Edit chart
Loading graph
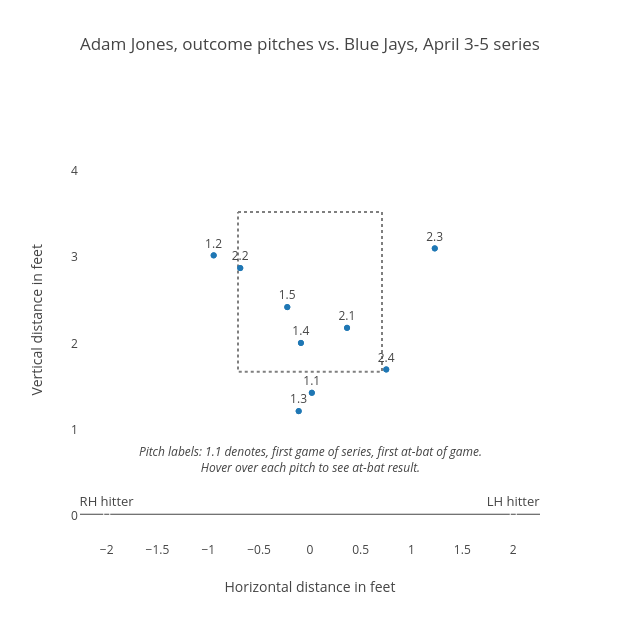
Grspur's interactive graph and data of "Adam Jones, outcome pitches vs. Blue Jays, April 3-5 series" is a , showing Vertical frame, Vertical zone, H, H; with Horizontal distance in feet in the x-axis and Vertical distance in feet in the y-axis.. The x-axis shows values from -2.2632226322263223 to 2.2632226322263223. The y-axis shows values from -0.2982625482625482 to 4.7982625482625485. This visualization has the following annotation: Pitch labels: 1.1 denotes, first game of series, first at-bat of game.Hover over each pitch to see at-bat result.