Edit chart
Loading graph
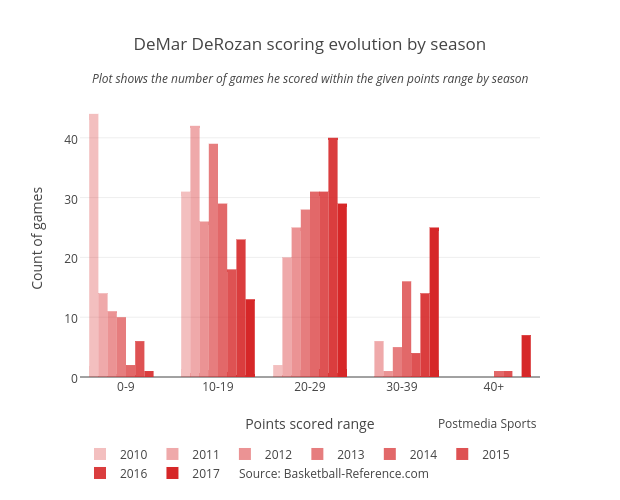
Grspur's interactive graph and data of "DeMar DeRozan scoring evolution by season" is a bar chart, showing 2010, 2011, 2012, 2013, 2014, 2015, 2016, 2017; with Points scored range in the x-axis and Count of games in the y-axis.. The x-axis shows values from -0.5 to 4.5. The y-axis shows values from 0 to 46.31578947368421. This visualization has the following annotations: Plot shows the number of games he scored within the given points range by season; Source: Basketball-Reference.com; Postmedia Sports