Edit chart
Loading graph
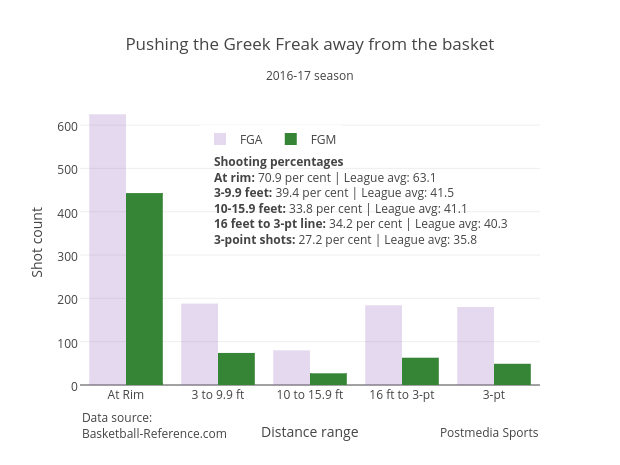
Grspur's interactive graph and data of "Pushing the Greek Freak away from the basket" is a bar chart, showing FGA vs FGM; with Distance range in the x-axis and Shot count in the y-axis.. The x-axis shows values from -0.5 to 4.5. The y-axis shows values from 0 to 657.8947368421053. This visualization has the following annotations: Shooting percentagesAt rim: 70.9 per cent | League avg: 63.13-9.9 feet: 39.4 per cent | League avg: 41.510-15.9 feet: 33.8 per cent | League avg: 41.116 feet to 3-pt line: 34.2 per cent | League avg: 40.33-point shots: 27.2 per cent | League avg: 35.8; 2016-17 season; Data source:Basketball-Reference.com; Postmedia Sports