Edit chart
Loading graph
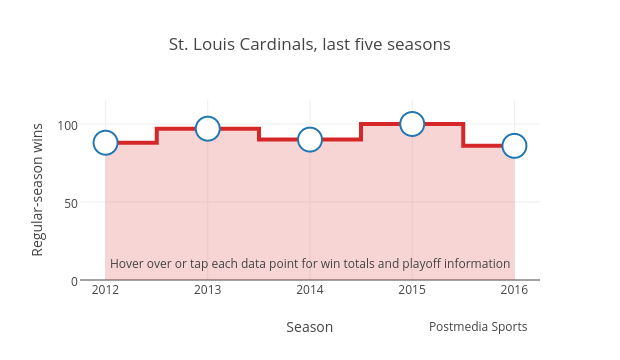
Grspur's interactive graph and data of "St. Louis Cardinals, last five seasons" is a filled line chart, showing B; with Season in the x-axis and Regular-season wins in the y-axis.. The x-axis shows values from 2011.75 to 2016.25. The y-axis shows values from 0 to 115.38461538461539. This visualization has the following annotations: Postmedia Sports; Hover over or tap each data point for win totals and playoff information