Edit chart
Loading graph
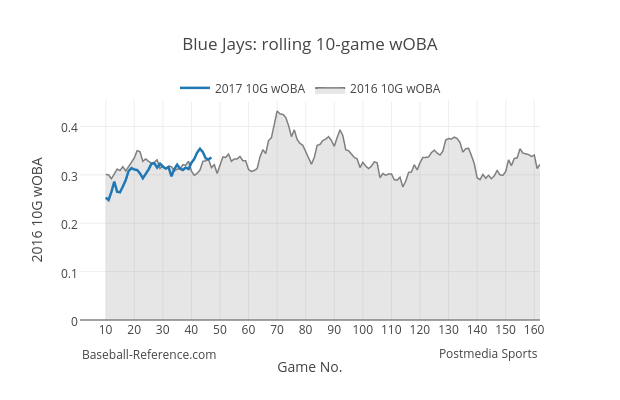
Grspur's interactive graph and data of "Blue Jays: rolling 10-game wOBA" is a filled line chart, showing 2016 10G wOBA vs 2017 10G wOBA; with Game No. in the x-axis and 2016 10G wOBA in the y-axis.. The x-axis shows values from 1 to 162. The y-axis shows values from 0 to 0.45473684210526316. This visualization has the following annotations: Baseball-Reference.com; Postmedia Sports