Edit chart
Loading graph
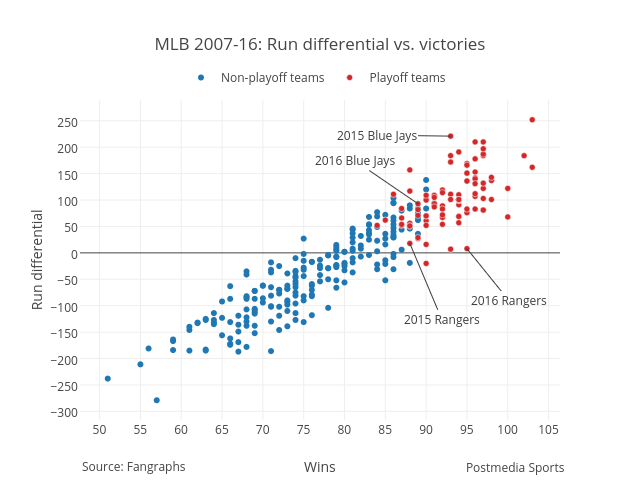
Grspur's interactive graph and data of "MLB 2007-16: Run differential vs. victories" is a scatter chart, showing Non-playoff teams vs Playoff teams; with Wins in the x-axis and Run differential in the y-axis.. The x-axis shows values from 47.600706713780916 to 106.39929328621908. The y-axis shows values from -316.38770053475935 to 289.38770053475935. This visualization has the following annotations: Source: Fangraphs; Postmedia Sports; 2015 Blue Jays; 2016 Blue Jays; 2016 Rangers; 2015 Rangers