Edit chart
Loading graph
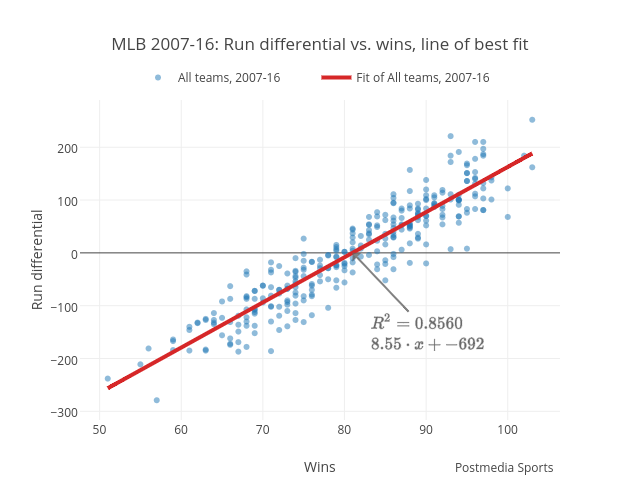
Grspur's interactive graph and data of "MLB 2007-16: Run differential vs. wins, line of best fit" is a scatter chart, showing All teams, 2007-16; with Wins in the x-axis and Run differential in the y-axis.. The x-axis shows values from 47.600706713780916 to 106.39929328621908. The y-axis shows values from -316.38770053475935 to 289.38770053475935. This visualization has the following annotations: Postmedia Sports; $$R^2 = 0.8560\\8.55\cdot x+-692$$