Edit chart
Loading graph
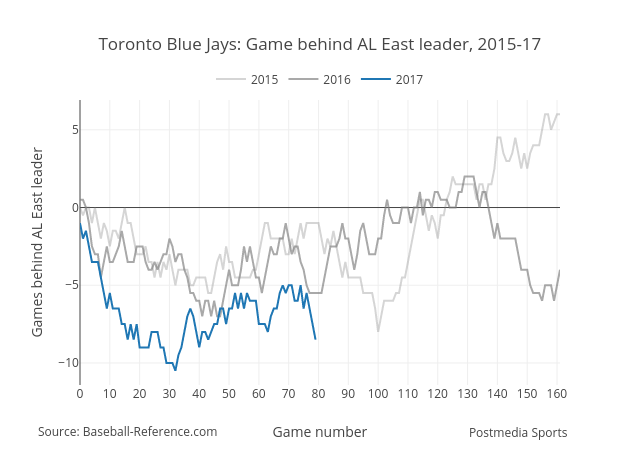
Grspur's interactive graph and data of "Toronto Blue Jays: Game behind AL East leader, 2015-17" is a line chart, showing 2015, 2016, 2017; with Game number in the x-axis and Games behind AL East leader in the y-axis.. The x-axis shows values from 0 to 161. The y-axis shows values from -11.416666666666666 to 6.916666666666667. This visualization has the following annotations: Source: Baseball-Reference.com; Postmedia Sports