Edit chart
Loading graph
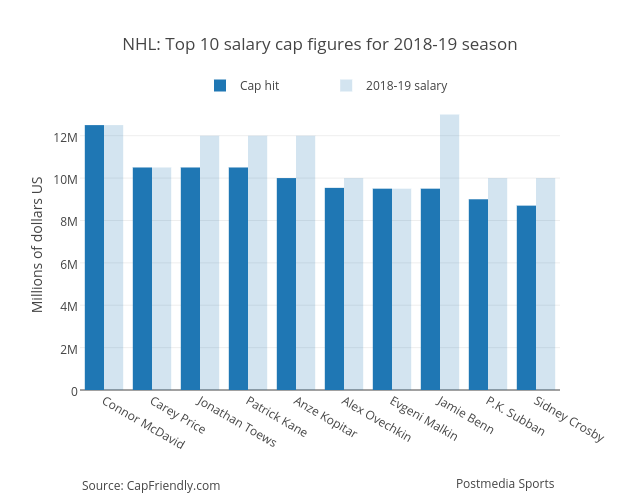
Grspur's interactive graph and data of "NHL: Top 10 salary cap figures for 2018-19 season" is a grouped bar chart, showing Cap hit vs 2018-19 salary; with Millions of dollars US in the y-axis. The x-axis shows values from -0.5 to 9.5. The y-axis shows values from 0 to 13684210.52631579. This visualization has the following annotations: Source: CapFriendly.com; Postmedia Sports