Edit chart
Loading graph
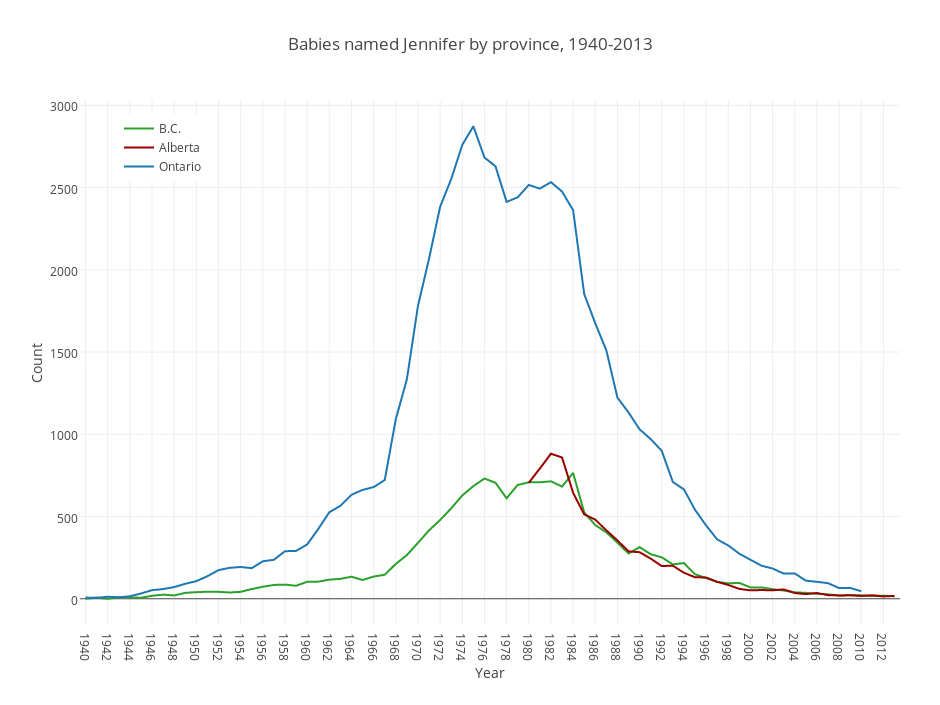
Grspur's interactive graph and data of "Babies named Jennifer by province, 1940-2013" is a scatter chart, showing B.C., Alberta, Ontario; with Year in the x-axis and Count in the y-axis.. The x-axis shows values from 1939.5 to 2013.5. The y-axis shows values from -159.61111111111111 to 3032.6111111111113.