Edit chart
Loading graph
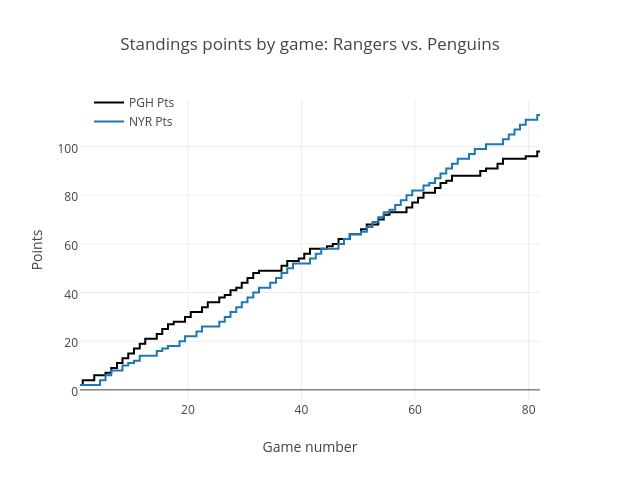
Grspur's interactive graph and data of "Standings points by game: Rangers vs. Penguins" is a line chart, showing PGH Pts vs NYR Pts; with Game number in the x-axis and Points in the y-axis.. The x-axis shows values from 1 to 82. The y-axis shows values from -4.166666666666666 to 119.16666666666667.