Edit chart
Loading graph
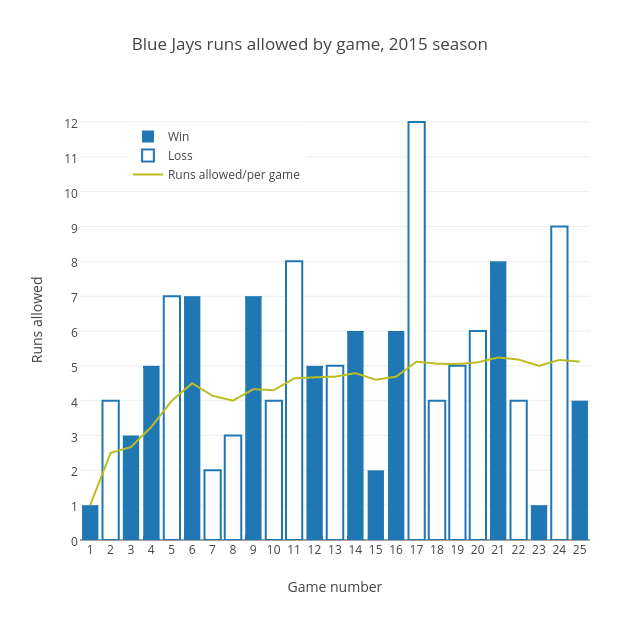
Grspur's interactive graph and data of "Blue Jays runs allowed by game, 2015 season" is a grouped bar chart, showing Win, Loss, Runs allowed/per game; with Game number in the x-axis and Runs allowed in the y-axis.. The x-axis shows values from 0.5 to 25.5. The y-axis shows values from 0 to 12.631578947368421.