Edit chart
Loading graph
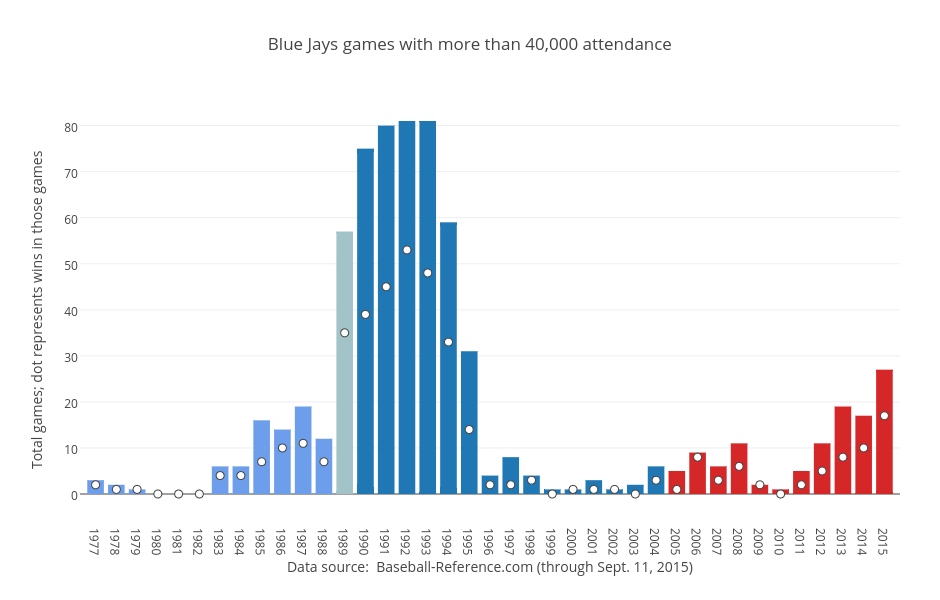
Grspur's interactive graph and data of "Blue Jays games with more than 40,000 attendance" is a overlaid bar chart, showing Exhibition, Ex/SkyD, SkyDome, Rogers Centre, Wins, Exhibition, Ex/SkyD, SkyDome, Rogers Centre, Wins; with Data source: Baseball-Reference.com (through Sept. 11, 2015) in the x-axis and Total games; dot represents wins in those games in the y-axis.. The x-axis shows values from 1976.25 to 2015.75. The y-axis shows values from -5.646112600536193 to 85.5603217158177.