Edit chart
Loading graph
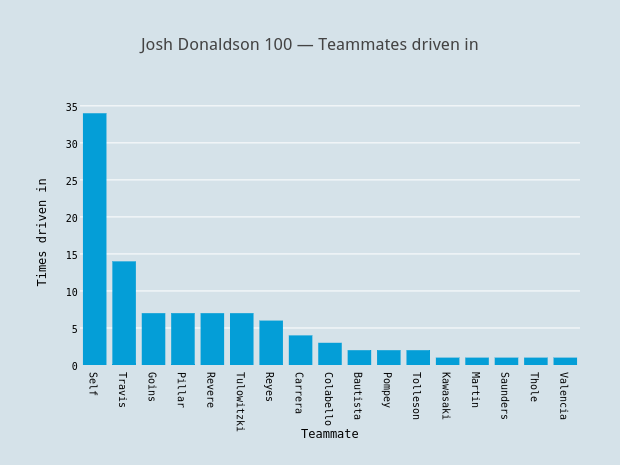
Grspur's interactive graph and data of "Josh Donaldson 100 — Teammates driven in" is a bar chart, showing RBItm; with Teammate in the x-axis and Times driven in in the y-axis.. The x-axis shows values from -0.5 to 16.5. The y-axis shows values from 0 to 35.78947368421053.