Edit chart
Loading graph
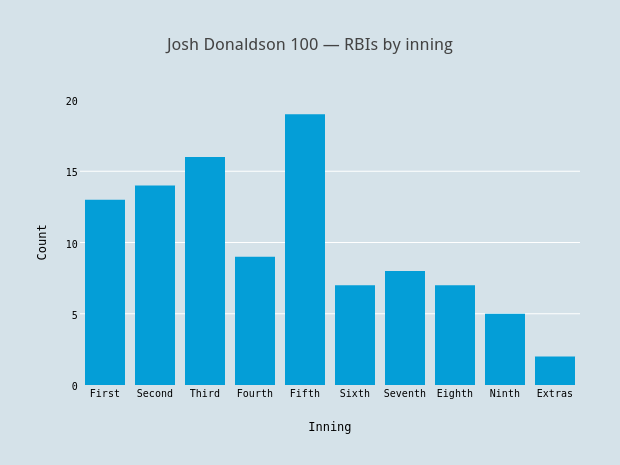
Grspur's interactive graph and data of "Josh Donaldson 100 — RBIs by inning" is a bar chart, showing RBIinn; with Inning in the x-axis and Count in the y-axis.. The x-axis shows values from -0.5 to 9.5. The y-axis shows values from 0 to 20.