Edit chart
Loading graph
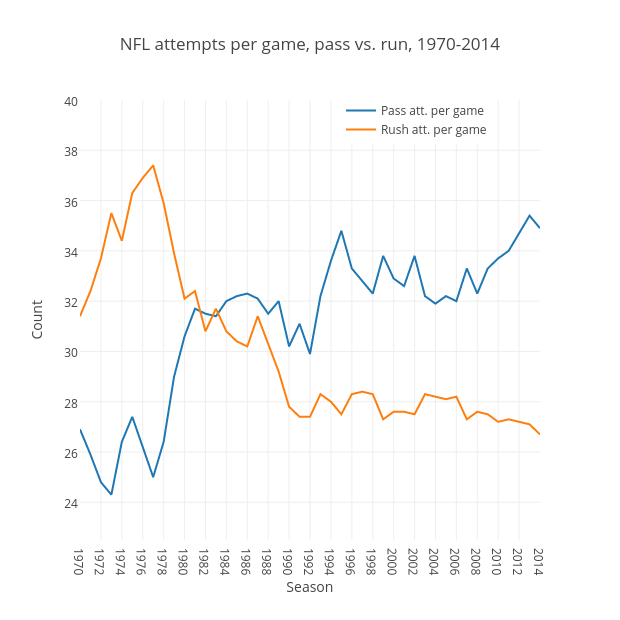
Grspur's interactive graph and data of "NFL attempts per game, pass vs. run, 1970-2014" is a scatter chart, showing Pass att. per game vs Rush att. per game; with Season in the x-axis and Count in the y-axis.. The x-axis shows values from 1970 to 2014. The y-axis shows values from 22.5 to 40.