Edit chart
Loading graph
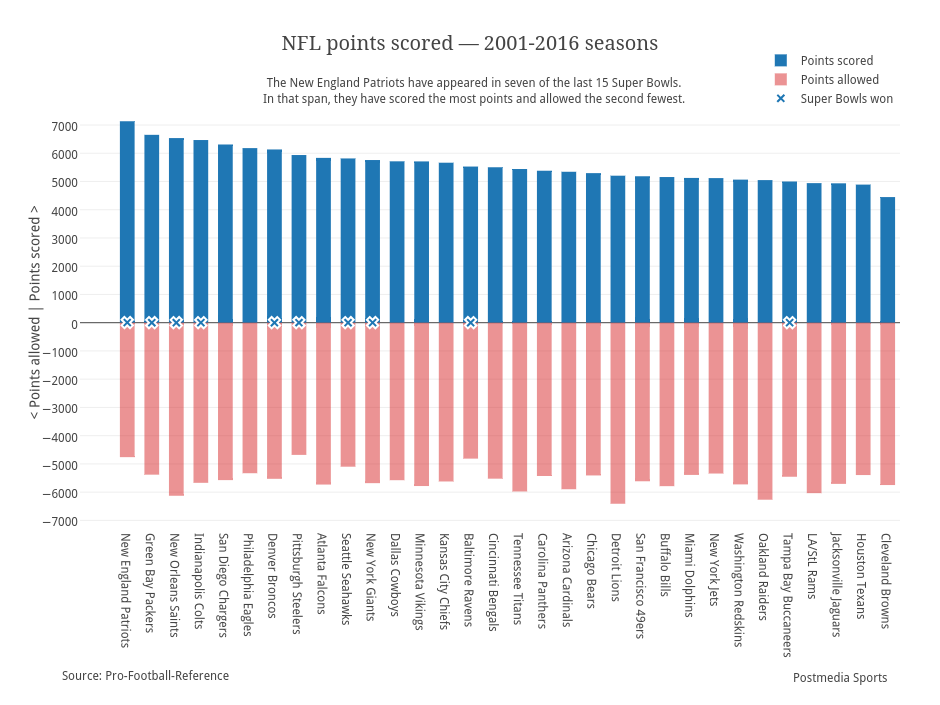
Grspur's interactive graph and data of "NFL points scored — 2001-2016 seasons" is a overlaid bar chart, showing Points scored, Points allowed, Super Bowls won; with in the y-axis. The x-axis shows values from -1.9260757036557747 to 31.5. The y-axis shows values from -7163.444444444444 to 7885.444444444444. This visualization has the following annotations: The New England Patriots have appeared in seven of the last 15 Super Bowls.In that span, they have scored the most points and allowed the second fewest.; Source: Pro-Football-Reference; Postmedia Sports