Edit chart
Loading graph
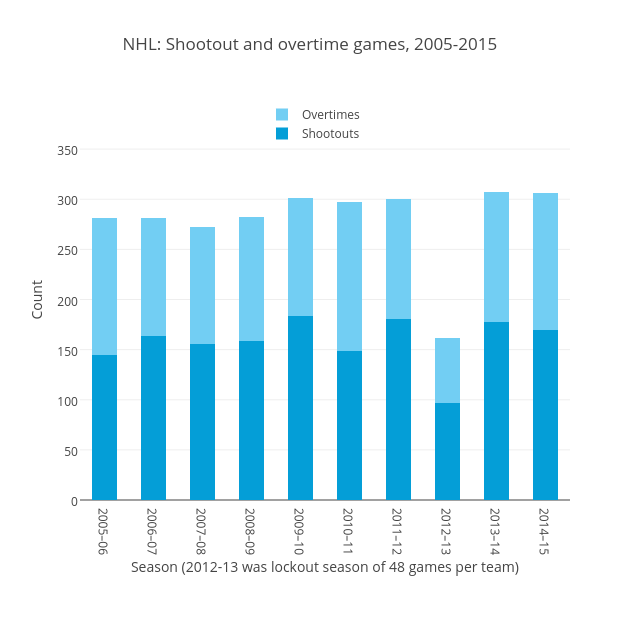
Grspur's interactive graph and data of "NHL: Shootout and overtime games, 2005-2015" is a stacked bar chart, showing Shootouts vs Overtimes; with Season (2012-13 was lockout season of 48 games per team) in the x-axis and Count in the y-axis.. The x-axis shows values from -0.5 to 9.5. The y-axis shows values from 0 to 399.