Edit chart
Loading graph
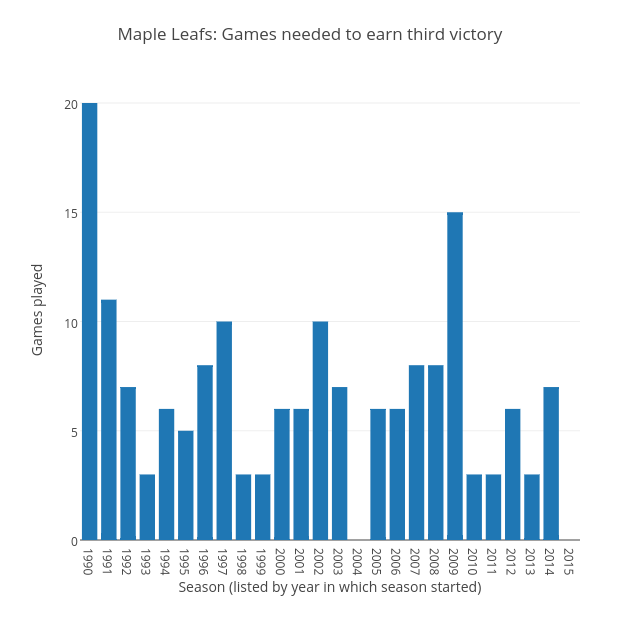
Grspur's interactive graph and data of "Maple Leafs: Games needed to earn third victory" is a bar chart, showing Games played; with Season (listed by year in which season started) in the x-axis and Games played in the y-axis.. The x-axis shows values from 1989.5 to 2015.5. The y-axis shows values from 0 to 21.05263157894737.