Edit chart
Loading graph
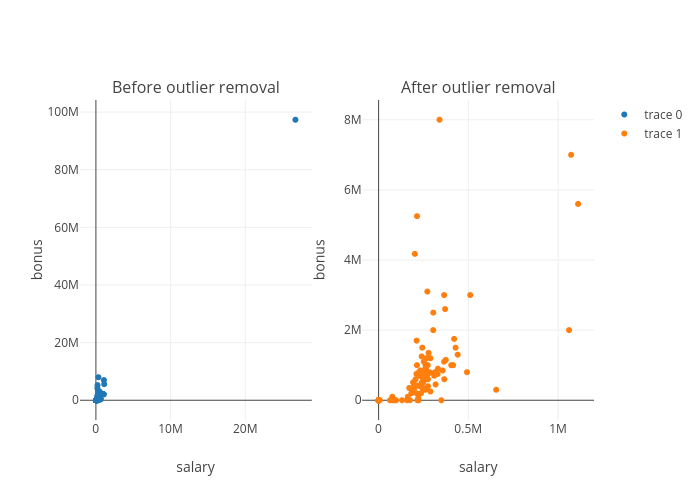
Hadaarjan's interactive graph and data is a scatter chart. The x-axis shows values from 0 to 0. The y-axis shows values from 0 to 0. This visualization has the following annotations: Before outlier removal; After outlier removal