Edit chart
Loading graph
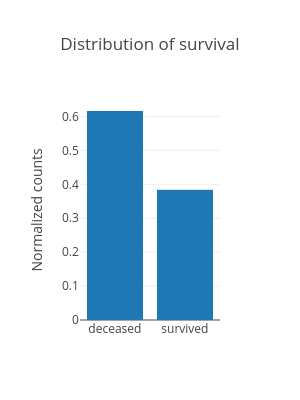
Hadaarjan's interactive graph and data of "Distribution of survival" is a bar chart; with Normalized counts in the y-axis. The x-axis shows values from 0 to 0. The y-axis shows values from 0 to 0.