Edit chart
Loading graph
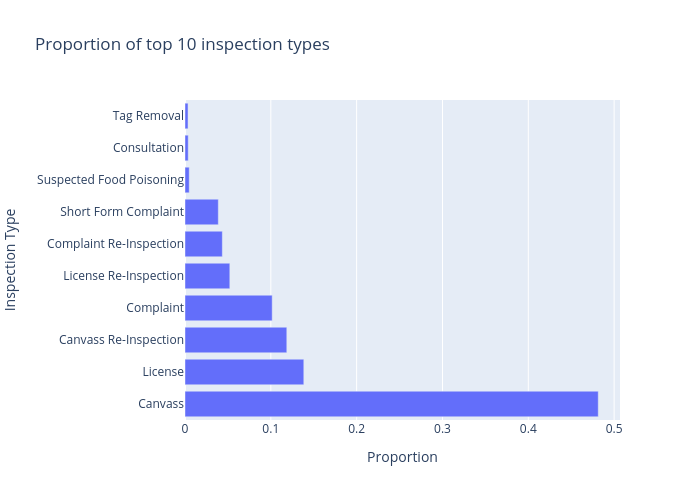
Hannaj's interactive graph and data of "Proportion of top 10 inspection types" is a bar chart; with Proportion in the x-axis and Inspection Type in the y-axis.. The x-axis shows values from 0 to 0. The y-axis shows values from 0 to 0.