Edit chart
Loading graph
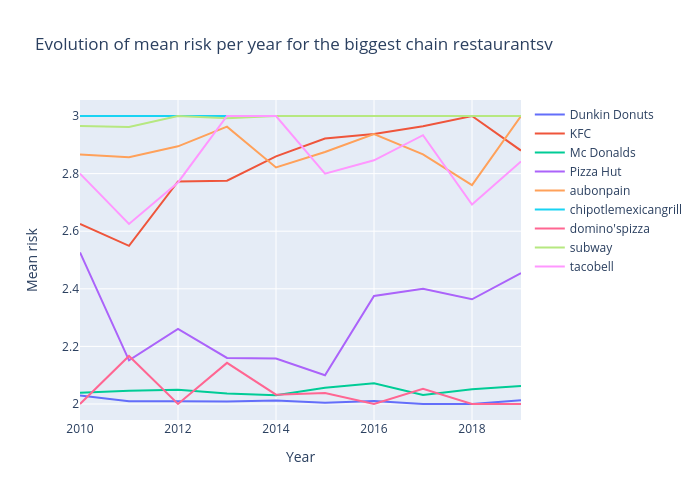
Hannaj's interactive graph and data of "Evolution of mean risk per year for the biggest chain restaurantsv" is a line chart, showing Dunkin Donuts, KFC, Mc Donalds, Pizza Hut, aubonpain, chipotlemexicangrill, domino'spizza, subway, tacobell; with Year in the x-axis and Mean risk in the y-axis.. The x-axis shows values from 0 to 0. The y-axis shows values from 0 to 0.