Edit chart
Loading graph
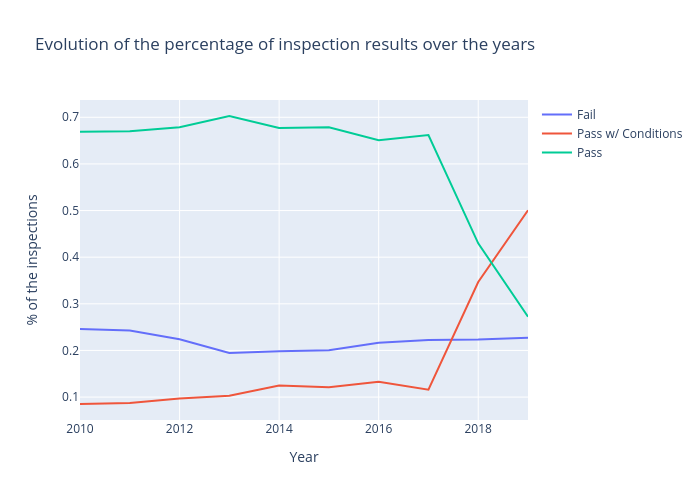
Hannaj's interactive graph and data of "Evolution of the percentage of inspection results over the years" is a line chart, showing Fail, Pass w/ Conditions, Pass; with Year in the x-axis and % of the inspections in the y-axis.. The x-axis shows values from 0 to 0. The y-axis shows values from 0 to 0.