Edit chart
Loading graph
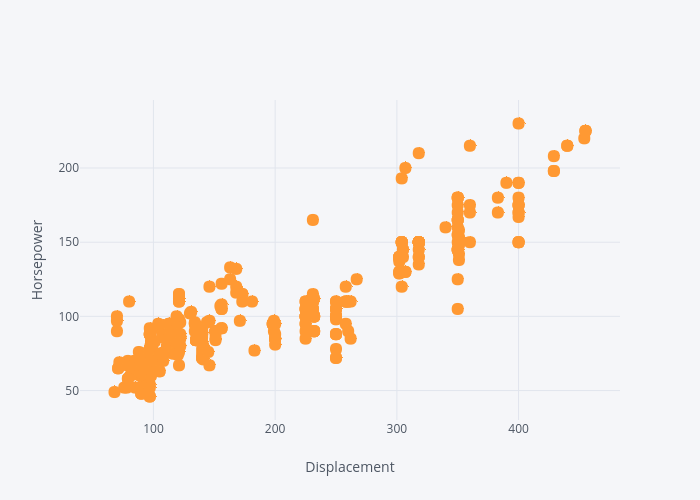
Hasanbdimran's interactive graph and data of "{'font': {'color': '#4D5663'}}" is a scatter chart, showing horsepower; with Displacement in the x-axis and Horsepower in the y-axis.. The x-axis shows values from 42.033859576235976 to 480.96614042376405. The y-axis shows values from 31.27459618208517 to 244.72540381791484.