Edit chart
Loading graph
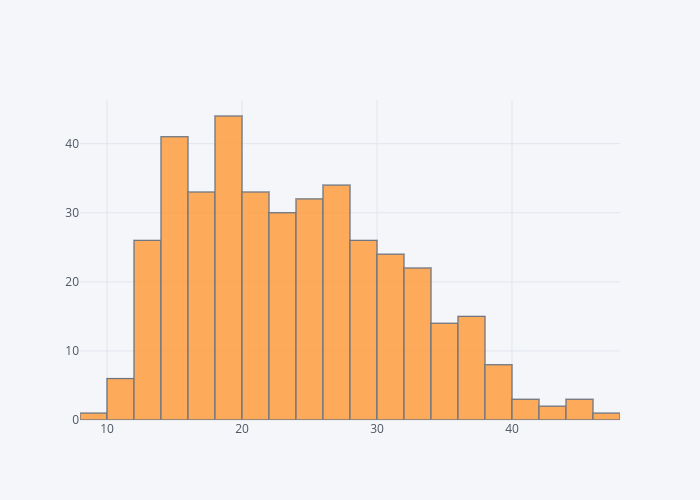
Hasanbdimran's interactive graph and data of "{'font': {'color': '#4D5663'}}" is a histogram, showing mpg. The x-axis shows values from 8 to 48. The y-axis shows values from 0 to 46.31578947368421.