Edit chart
Loading graph
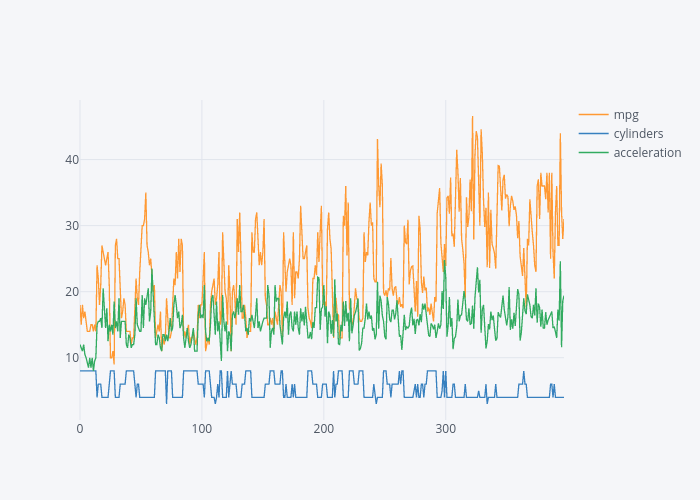
Hasanbdimran's interactive graph and data of "{'font': {'color': '#4D5663'}}" is a line chart, showing mpg, cylinders, acceleration. The x-axis shows values from 0 to 397. The y-axis shows values from 0.5777777777777775 to 49.022222222222226.