Edit chart
Loading graph
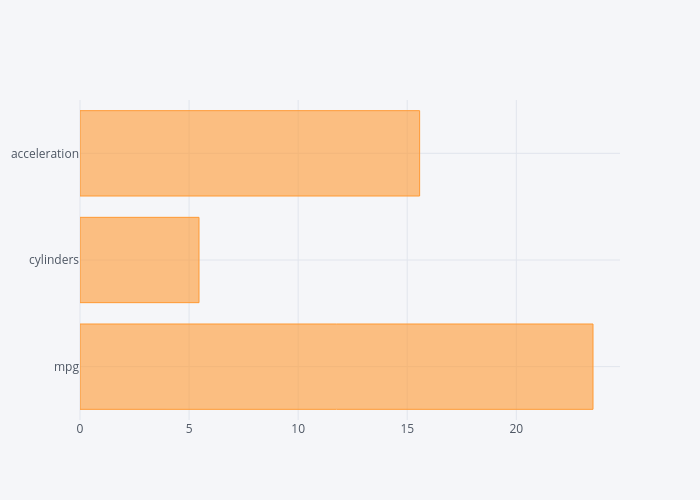
Hasanbdimran's interactive graph and data of "{'font': {'color': '#4D5663'}}" is a bar chart, showing None. The x-axis shows values from 0 to 24.752181962443807. The y-axis shows values from -0.5 to 2.5.