Edit chart
Loading graph
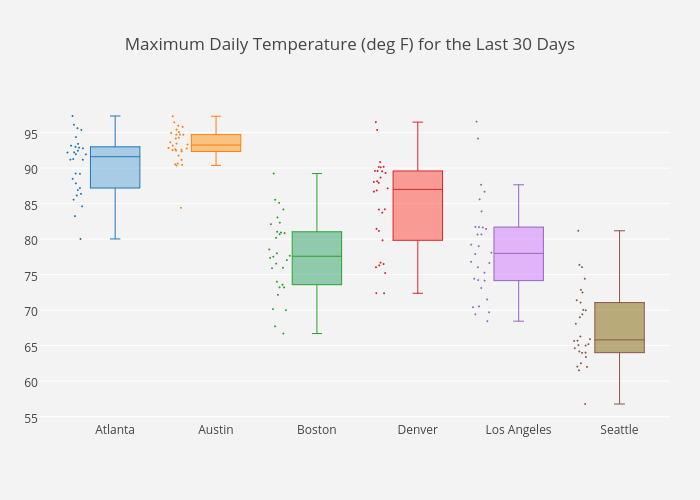
Hdavis's interactive graph and data of "Maximum Daily Temperature (deg F) for the Last 30 Days" is a box plot, showing Atlanta, Austin, Boston, Denver, Los Angeles, Seattle. The x-axis shows values from 0 to 0. The y-axis shows values from 0 to 0.