Edit chart
Loading graph
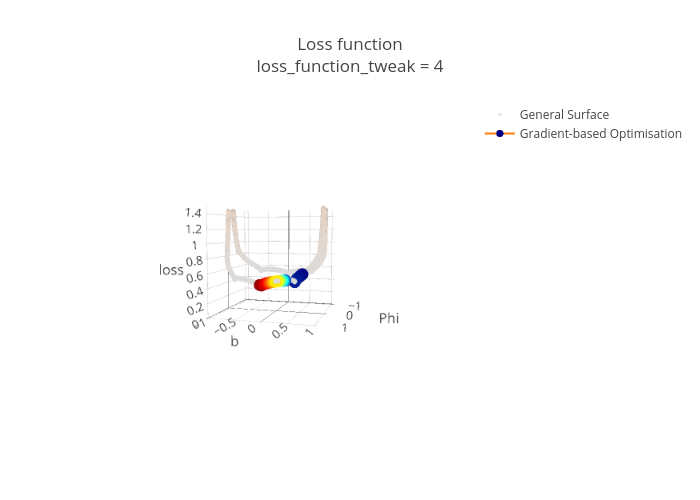
Hfwittmann's interactive graph and data of "Loss functionloss_function_tweak = 4" is a scatter3d, showing General Surface vs Gradient-based Optimisation. The x-axis shows values from 0 to 0. The y-axis shows values from 0 to 0.