Edit chart
Loading graph
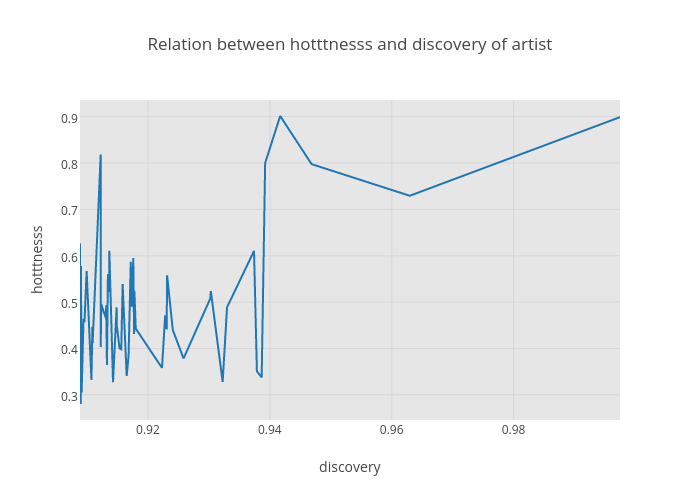
Highsparrow's interactive graph and data of "Relation between hotttnesss and discovery of artist" is a line chart, showing hotttness vs discovery ; with discovery in the x-axis and hotttnesss in the y-axis.. The x-axis shows values from 0.908833 to 0.997445. The y-axis shows values from 0.24564819952338884 to 0.9359216060556111.