Edit chart
Loading graph
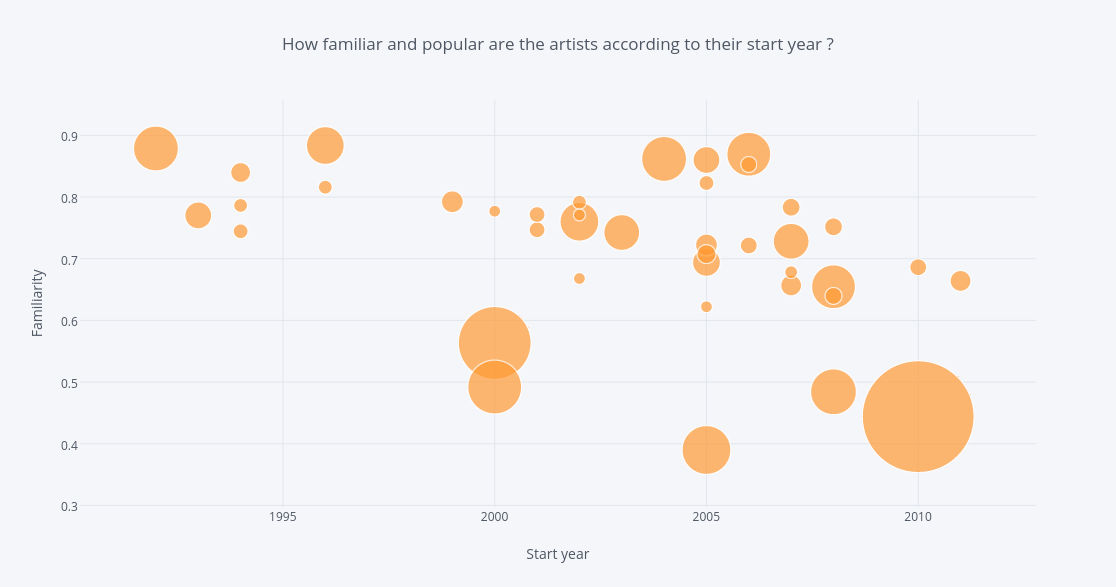
Highsparrow's interactive graph and data of "How familiar and popular are the artists according to their start year ?" is a scatter chart, showing y; with Start year in the x-axis and Familiarity in the y-axis.. The x-axis shows values from 1990.207143091404 to 2012.7816732806402. The y-axis shows values from 0.29736931994033755 to 0.9573520513657126.