Edit chart
Loading graph
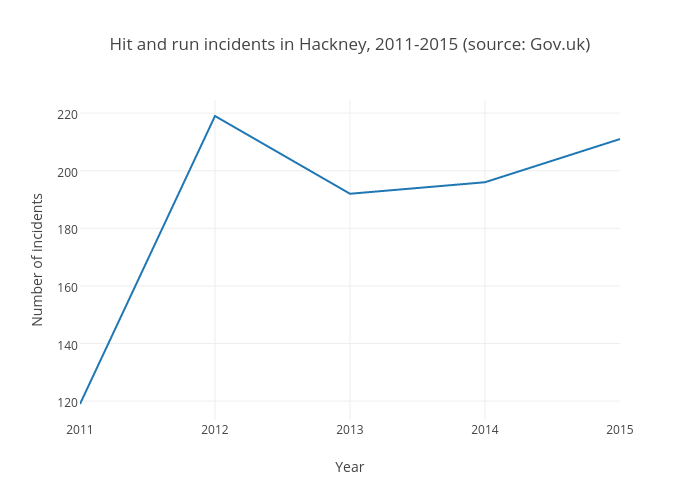
Hollypatrick's interactive graph and data of "Hit and run incidents in Hackney, 2011-2015 (source: Gov.uk)" is a line chart, showing B; with Year in the x-axis and Number of incidents in the y-axis.. The x-axis shows values from 2011 to 2015. The y-axis shows values from 113.44444444444444 to 224.55555555555554.