Edit chart
Loading graph
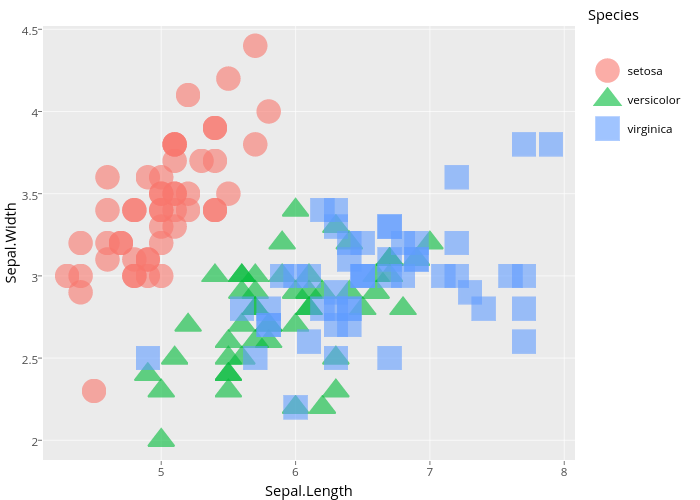
Holtzy's interactive graph and data of "Sepal.Width vs Sepal.Length" is a scatter chart, showing setosa, versicolor, virginica; with Sepal.Length in the x-axis and Sepal.Width in the y-axis.. The x-axis shows values from 4.12 to 8.08. The y-axis shows values from 1.88 to 4.52. This visualization has the following annotation: Species