Edit chart
Loading graph
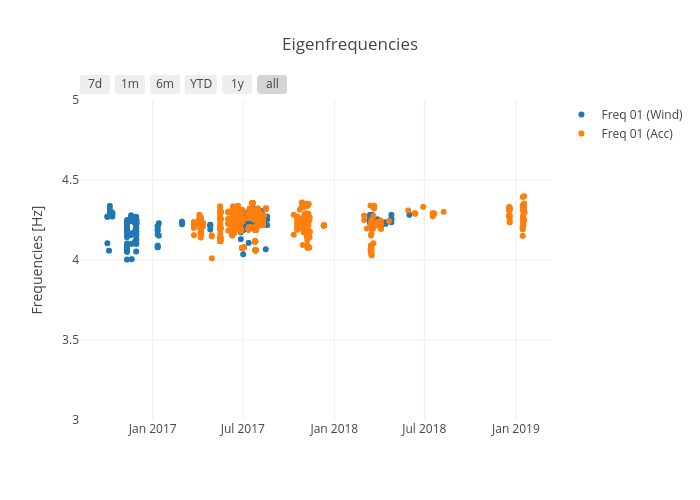
Honr's interactive graph and data of "Eigenfrequencies" is a scatter chart, showing Freq 01 (Wind) vs Freq 01 (Acc); with time in the x-axis and Frequencies [Hz] in the y-axis.. The x-axis shows values from 0 to 0. The y-axis shows values from 3 to 5.