Edit chart
Loading graph
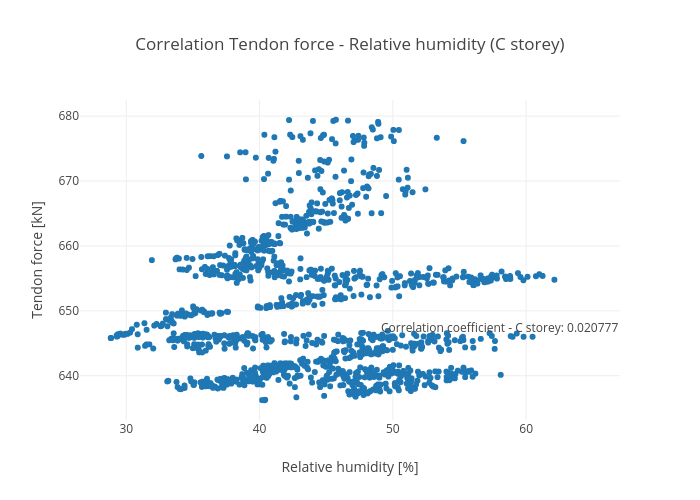
Honr's interactive graph and data of "Correlation Tendon force - Relative humidity (C storey)" is a scatter chart; with Relative humidity [%] in the x-axis and Tendon force [kN] in the y-axis.. The x-axis shows values from 0 to 0. The y-axis shows values from 0 to 0. This visualization has the following annotation: Correlation coefficient - C storey: 0.020777