Edit chart
Loading graph
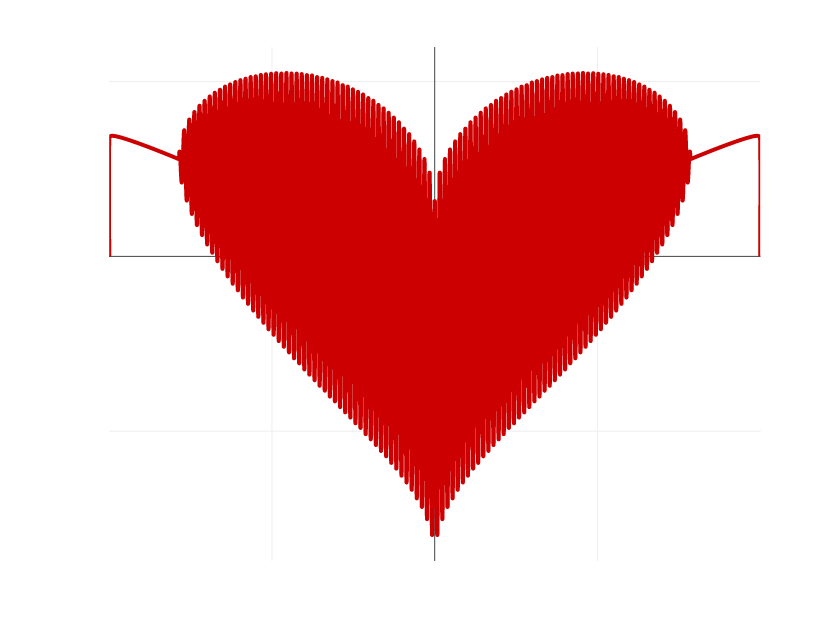
Huabinwu's interactive graph and data is a line chart. The x-axis shows values from -2 to 2. The y-axis shows values from -1.7405142777777778 to 1.1961912777777777. This visualization has the following annotation: