Edit chart
Loading graph
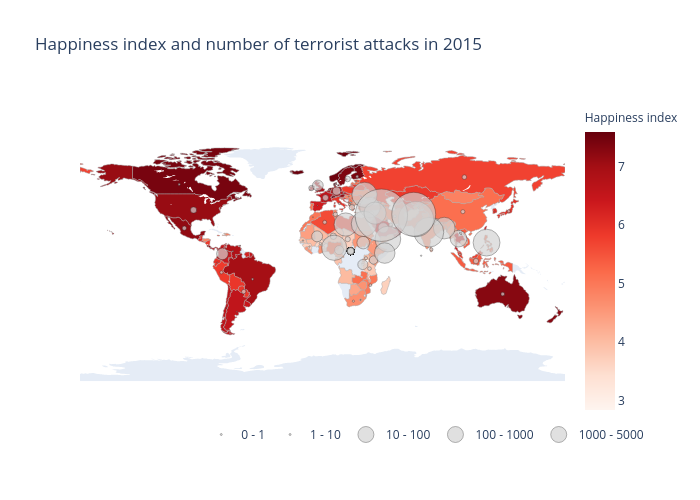
Hugaguett's interactive graph and data of "Happiness index and number of terrorist attacks in 2015" is a choropleth, showing 0 - 1, 1 - 10, 10 - 100, 100 - 1000, 1000 - 5000. The x-axis shows values from 0 to 0. The y-axis shows values from 0 to 0.