Edit chart
Loading graph
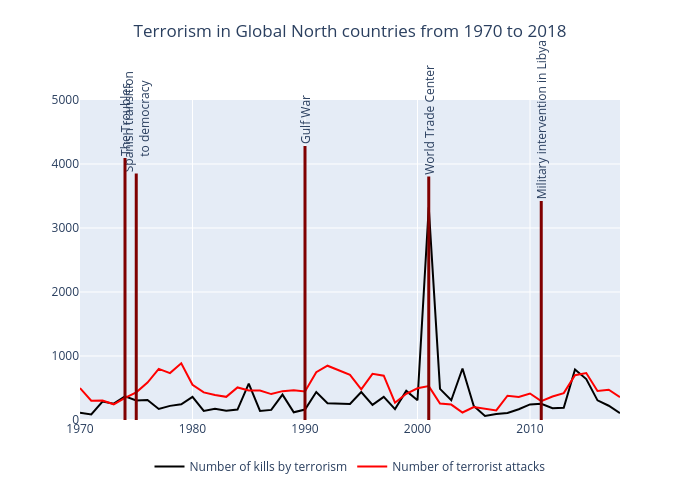
Hugaguett's interactive graph and data of "Terrorism in Global North countries from 1970 to 2018" is a scatter chart, showing Number of kills by terrorism vs Number of terrorist attacks. The x-axis shows values from 0 to 0. The y-axis shows values from 0 to 5000. This visualization has the following annotations: World Trade Center; Spanish transition to democracy; The Troubles; Gulf War; Military intervention in Libya