Edit chart
Loading graph
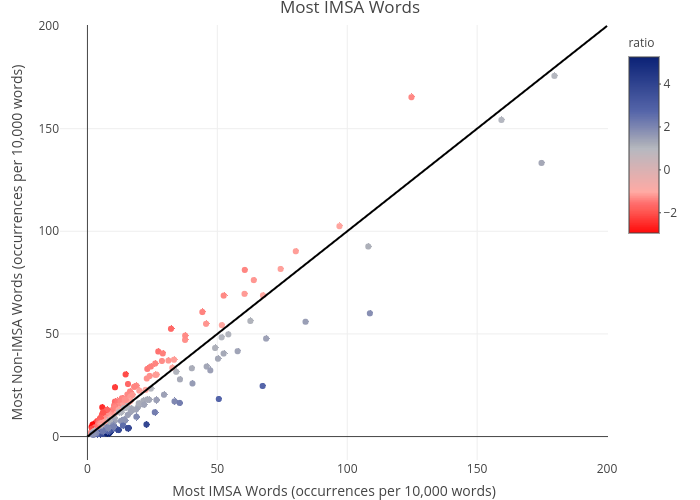
Hwittich's interactive graph and data of "Most IMSA Words" is a scatter chart; with Most IMSA Words (occurrences per 10,000 words) in the x-axis and Most Non-IMSA Words (occurrences per 10,000 words) in the y-axis.. The x-axis shows values from 0 to 0. The y-axis shows values from 0 to 0.