Edit chart
Loading graph
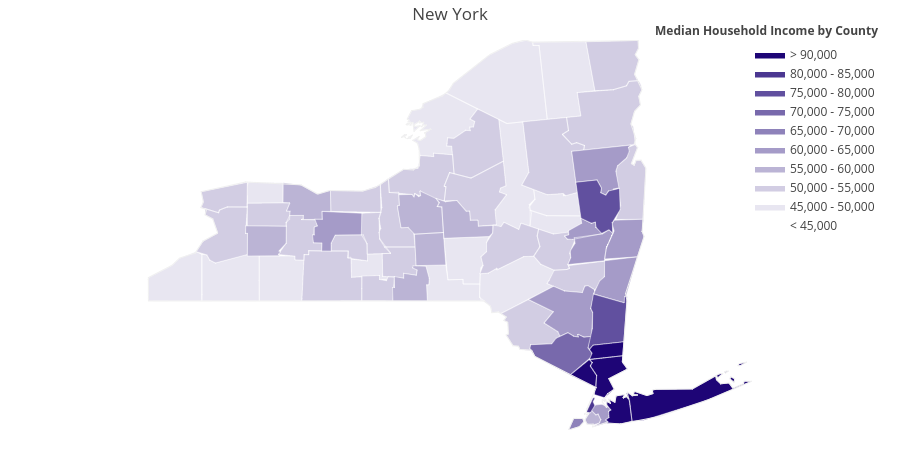
Hyunchoi98's interactive graph and data of "New York" is a filled line chart, showing 90,000, US Counties. The x-axis shows values from -81.44411674999999 to -70.17424924999999. The y-axis shows values from 40.507903 to 45.01585. This visualization has the following annotation: Median Household Income by County