Edit chart
Loading graph
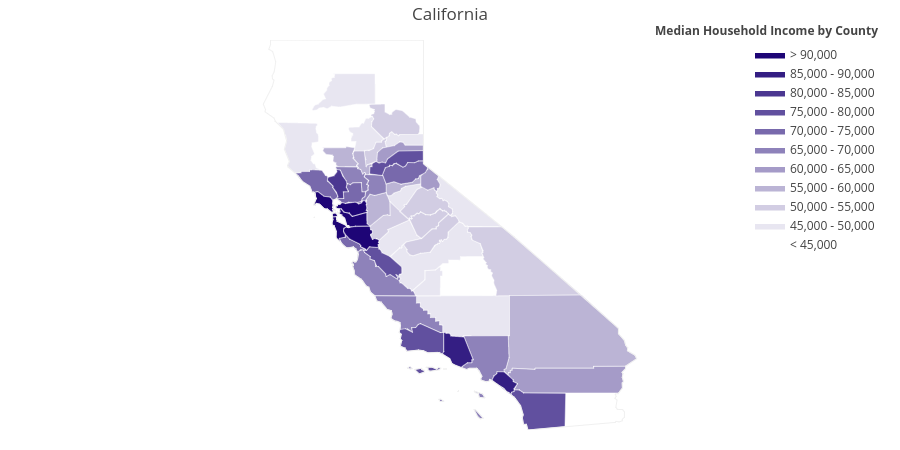
Hyunchoi98's interactive graph and data of "California" is a filled line chart, showing 90,000, US Counties. The x-axis shows values from -131.10331461644512 to -107.43649738355487. The y-axis shows values from 32.534155999999996 to 42.000882893156096. This visualization has the following annotation: Median Household Income by County