Edit chart
Loading graph
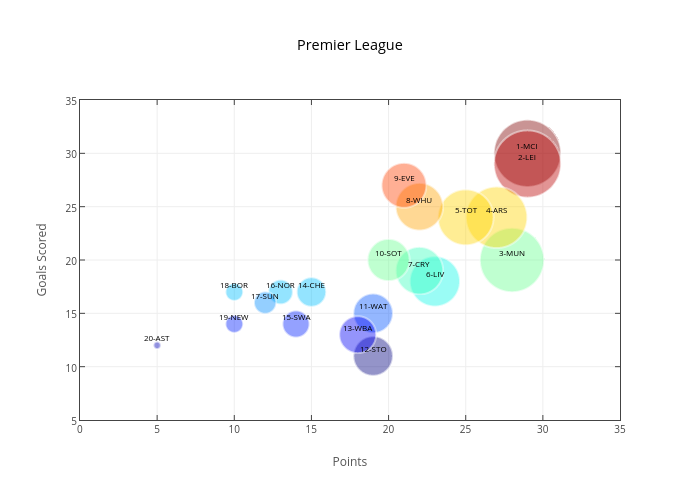
Iamaziz's interactive graph and data of "Premier League" is a scatter chart. The x-axis shows values from 0 to 0. The y-axis shows values from 0 to 0. This visualization has the following annotations: 1-MCI; 2-LEI; 3-MUN; 4-ARS; 5-TOT; 6-LIV; 7-CRY; 8-WHU; 9-EVE; 10-SOT; 11-WAT; 12-STO; 13-WBA; 14-CHE; 15-SWA; 16-NOR; 17-SUN; 18-BOR; 19-NEW; 20-AST