Edit chart
Loading graph
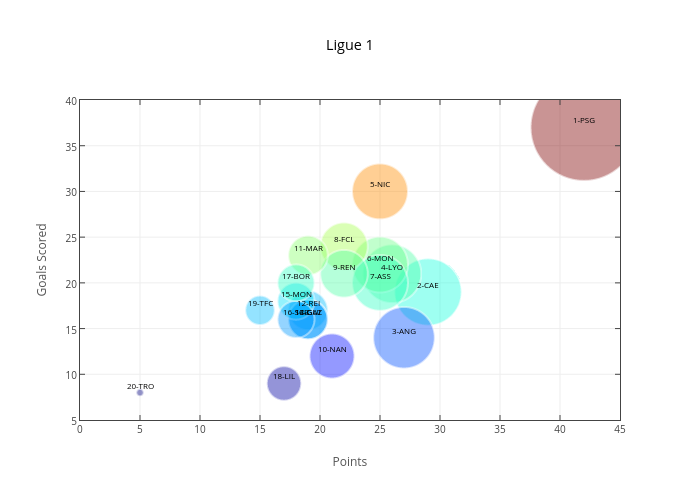
Iamaziz's interactive graph and data of "Ligue 1" is a scatter chart. The x-axis shows values from 0 to 0. The y-axis shows values from 0 to 0. This visualization has the following annotations: 1-PSG; 2-CAE; 3-ANG; 4-LYO; 5-NIC; 6-MON; 7-ASS; 8-FCL; 9-REN; 10-NAN; 11-MAR; 12-REI; 13-GAZ; 14-GUI; 15-MON; 16-SCB; 17-BOR; 18-LIL; 19-TFC; 20-TRO