Edit chart
Loading graph
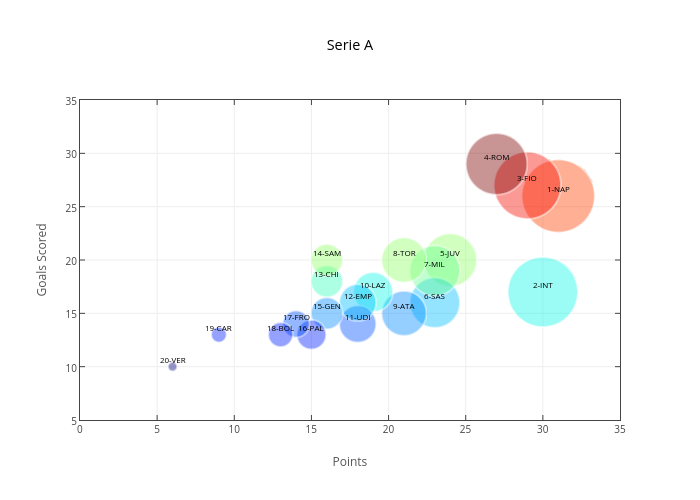
Iamaziz's interactive graph and data of "Serie A" is a scatter chart. The x-axis shows values from 0 to 0. The y-axis shows values from 0 to 0. This visualization has the following annotations: 1-NAP; 2-INT; 3-FIO; 4-ROM; 5-JUV; 6-SAS; 7-MIL; 8-TOR; 9-ATA; 10-LAZ; 11-UDI; 12-EMP; 13-CHI; 14-SAM; 15-GEN; 16-PAL; 17-FRO; 18-BOL; 19-CAR; 20-VER