Edit chart
Loading graph
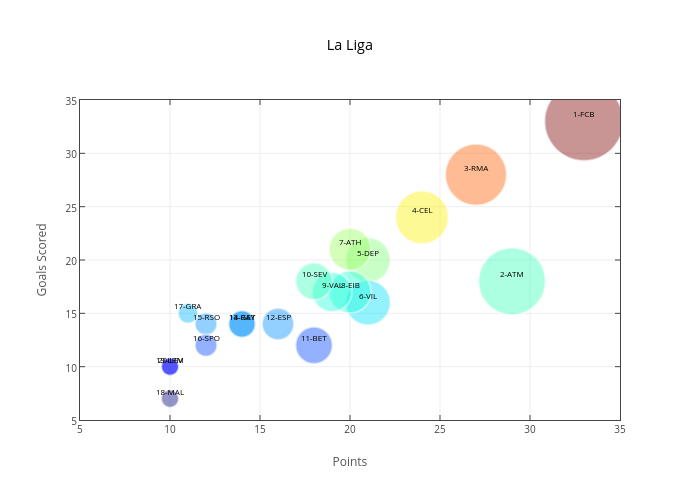
Iamaziz's interactive graph and data of "La Liga" is a scatter chart. The x-axis shows values from 0 to 0. The y-axis shows values from 0 to 0. This visualization has the following annotations: 1-FCB; 2-ATM; 3-RMA; 4-CEL; 5-DEP; 6-VIL; 7-ATH; 8-EIB; 9-VAL; 10-SEV; 11-BET; 12-ESP; 13-GET; 14-RAY; 15-RSO; 16-SPO; 17-GRA; 18-MAL; 19-LPM; 20-LEV