Edit chart
Loading graph
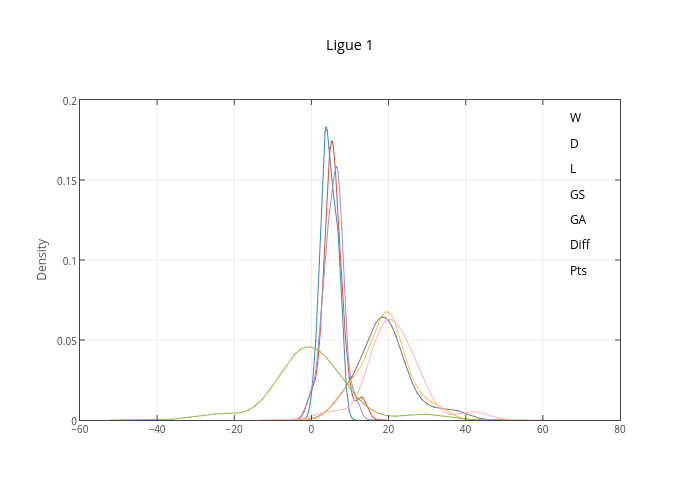
Iamaziz's interactive graph and data of "Ligue 1" is a line chart, showing W, D, L, GS, GA, Diff, Pts. The x-axis shows values from 0 to 0. The y-axis shows values from 0 to 0. This visualization has the following annotations: W; D; L; GS; GA; Diff; Pts