Edit chart
Loading graph
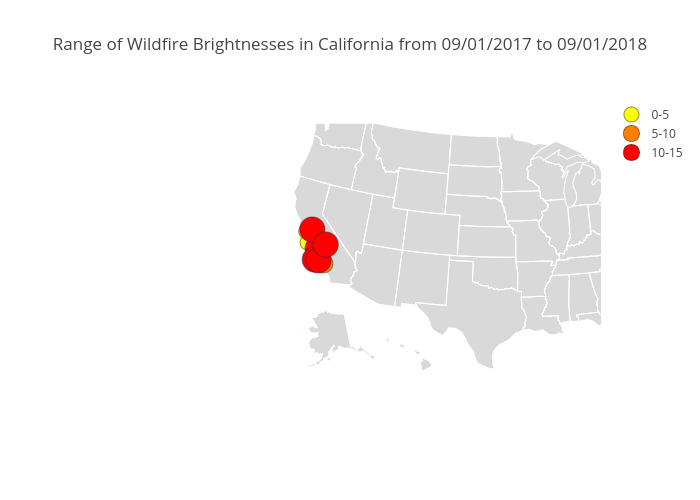
Iamciera's interactive graph and data of "Range of Wildfire Brightnesses in California from 09/01/2017 to 09/01/2018" is a scattergeo, showing 0-5, 5-10, 10-15. The x-axis shows values from 0 to 0. The y-axis shows values from 0 to 0.