Edit chart
Loading graph
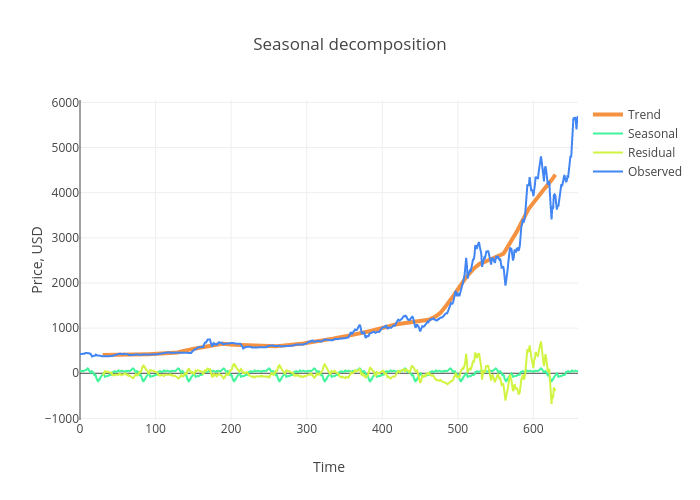
Ibobriakov's interactive graph and data of "Seasonal decomposition" is a line chart, showing Trend, Seasonal, Residual, Observed; with Time in the x-axis and Price, USD in the y-axis.. The x-axis shows values from 0 to 659. The y-axis shows values from -1035.0328312860943 to 6053.471688699267.